SQL + AI
AI Database Agent, Part 6: Observability and Production Packaging — What the Traces Showed
OpenTelemetry traces and metrics across the whole pipeline, an audit log in a separate database, and a hardened container. Then a 132-question workload: the model is 96% of the time, and the first trace found a 2-second IPv6 localhost penalty on every new connection.
Part 6 of the AI Database Agent series. Previously: Part 5 — tool calling with a 7B model.
The gap
After V5 the agent was accurate enough to talk about and safe by construction, but it could only be observed one request at a time. The response carried model time, tokens and query time; the API logged one line per question. Nothing answered "how is it doing?", nothing was kept, and a slow question couldn't be taken apart. This part adds the operational layer — no accuracy changes — and then uses it.
What was added
Traces. A BCL ActivitySource in the core library (no SDK there), exported by the API with OpenTelemetry
over OTLP. One question is one trace:
POST /api/ask
└─ agent.ask                       version, outcome, attempts, rows
   ├─ agent.retrieve               definitions/examples retrieved (V4+)
   │  └─ embeddings nomic-embed-text      (Microsoft.Extensions.AI, GenAI conventions)
   ├─ chat qwen2.5-coder:7b        one per model call, with token counts
   ├─ agent.validate               valid?, the issues found
   ├─ db.estimate                  estimated cost; the SQL is on the span
   └─ db.execute                   rows returned, SQL Server error number on failure
Question text is never a span attribute: it is free user input. The generated SQL is, because it is what an operator needs to debug a slow or failed query.
Metrics. Questions by version and outcome, end-to-end and per-stage latency, attempts per question, validator findings by kind (flagged when security-relevant), tokens, and dropped audit records.
An audit log — one row per question, in a separate AgentOps database. The agent reads the business
database as a least-privilege user and never writes to it; its own records live elsewhere, with an identity
that can only INSERT. Rows carry the trace id, so a row leads to its trace and back. Writes go through a
bounded queue and a background writer: a slow or missing audit database costs records, never answers.
Packaging. A multi-stage Dockerfile on a chiseled (distroless, non-root) .NET 10 image — 267 MB;
docker-compose profiles for the API and an Aspire dashboard; forwarded headers trusted only from configured
proxies (behind Nginx, every visitor would otherwise share the proxy's rate-limit bucket); a concurrency cap on
/api/ask, because a local model serves one request at a time; and GitHub Actions for the build, unit tests and
the image.
A real workload
The 44 benchmark questions (development and held-out) sent through the API for V3, V4 and V5 — 132 requests in four minutes on one machine with Ollama on the local GPU — straight from the audit log:
| Answered | Declined | Rejected / failed | p50 | p95 | Avg input tokens | Non-model time (avg) | |
|---|---|---|---|---|---|---|---|
| V3 | 35 | 8 | 1 | 1.32 s | 2.68 s | 2,171 | 36 ms |
| V4 | 35 | 9 | 0 | 1.66 s | 3.25 s | 2,651 | 157 ms |
| V5 | 36 | 8 | 0 | 2.10 s | 6.14 s | 7,697 | 52 ms |
Declines include the six questions that should be declined — writes, salaries, a prompt injection. Accuracy is the benchmark's job; this is operational data.
- The model is 96% of the time. Retrieval, validation, the cost estimate and execution together average 36–157 ms. At this scale, optimising anything but the model call is pointless.
- V5 costs 2.9× V4's input tokens for the same held-out accuracy: tool definitions and the self-check turn. Its "more than one attempt" count (38 of 44) is the self-check, not repairs — a metric that needs its definition written next to it.
- V3's one failure was "Who is the highest paid employee?": three replies with neither SQL nor a refusal. V4 and V5 declined it, citing the glossary's note that salaries are confidential.
What the first trace found
The slowest V4 question was "How many customers do we have?" — 5.05 s, with a 0.89 s model call. The audit log could say that it was slow, not why. The trace could:
agent.ask                               5.05 s
├─ agent.retrieve                       4.14 s
│  └─ embeddings nomic-embed-text       2.04 s
│     (then 1.9 s with no span, then two Qdrant calls of 15 ms and 1 ms)
├─ chat qwen2.5-coder:7b                0.89 s
└─ validate + estimate + execute        0.01 s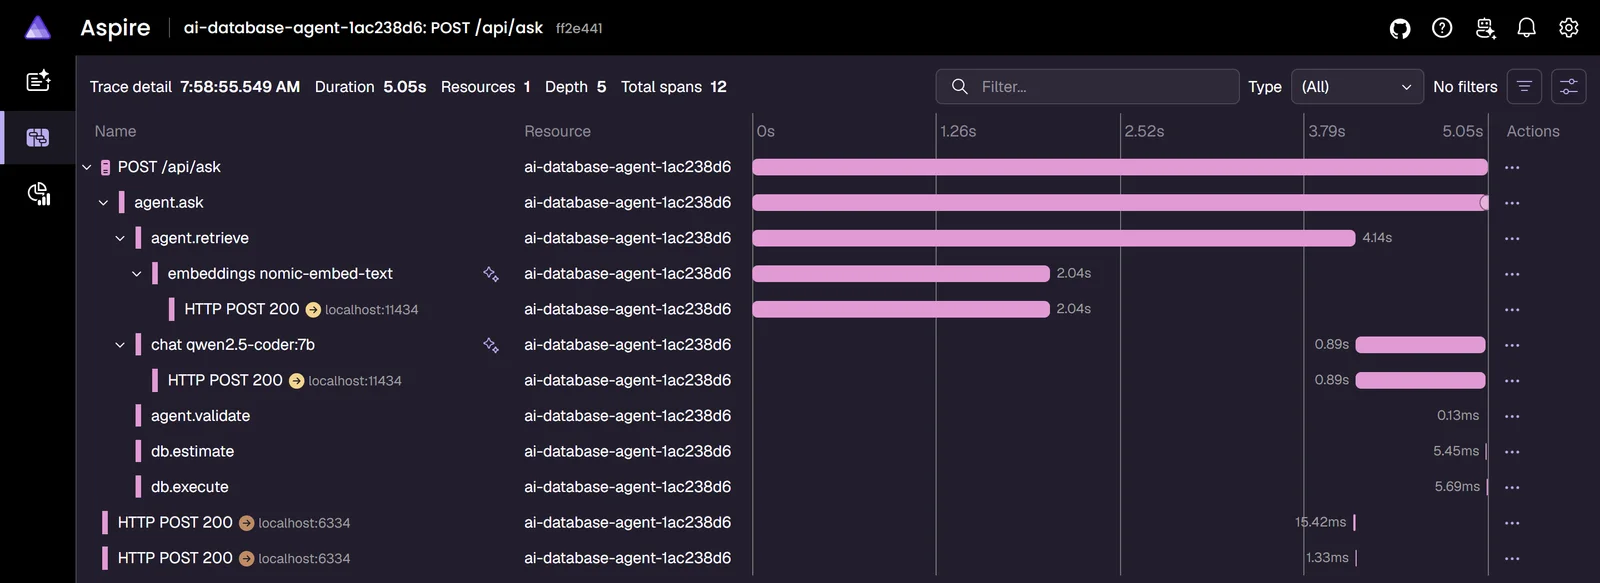
The trace as recorded, in the Aspire dashboard. Note the localhost targets.
Two gaps of almost exactly two seconds, both on the first connection to a service. A socket test found the cause:
localhost:11434   2055 ms        127.0.0.1:11434   25 ms
localhost:6334    2043 ms        127.0.0.1:6334     0.3 ms
On Windows, localhost resolves to ::1 first; Ollama and the Qdrant container listen on IPv4 only, so every
new connection waited about two seconds for the IPv6 attempt to fail. HTTP connections are pooled but closed
when idle, so this wasn't only a start-up cost: after a quiet spell the next question could pay it again. The
fix was configuration — 127.0.0.1 in the defaults. The same cold request afterwards: retrieval 4.14 s →
55 ms, embeddings 2.04 s → 36 ms. As a side effect, the integration test suite went from 42 s to 10 s.
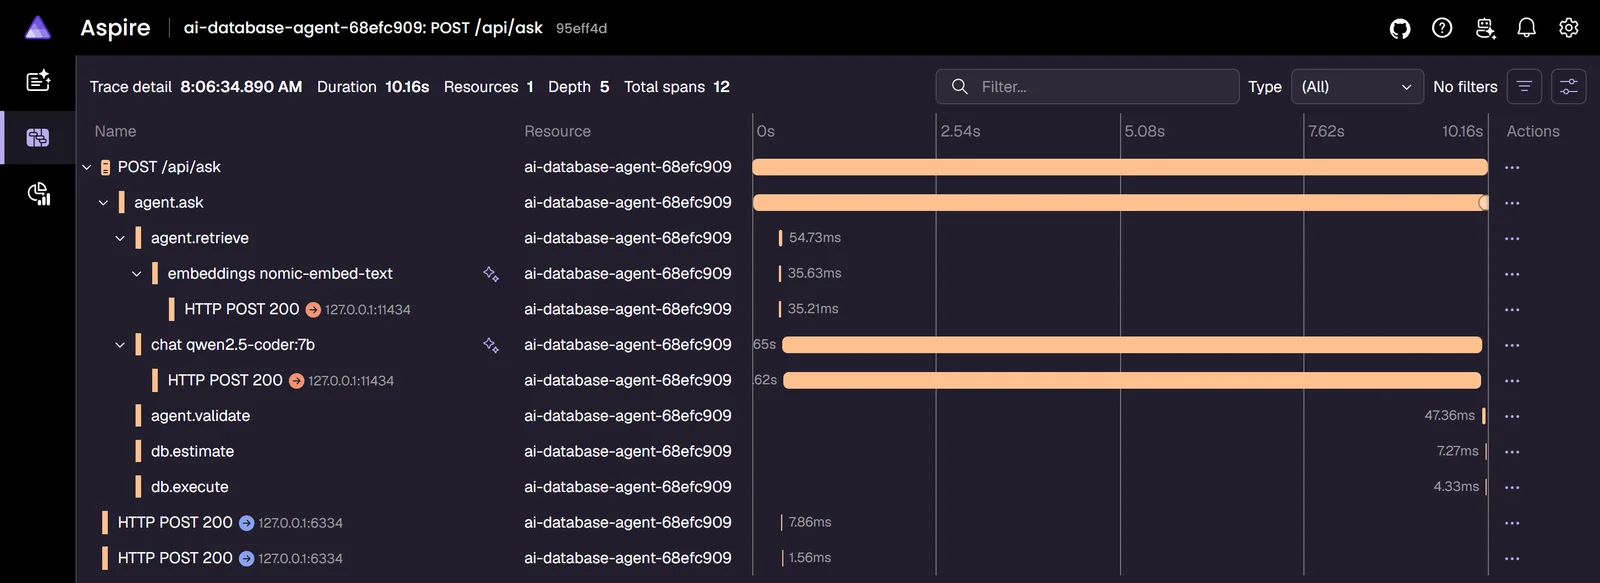
The same kind of cold request after the fix: retrieval is a sliver, and the long bar is the model loading.
The same trace showed what was left: 9.65 s in one chat span — Ollama loading qwen2.5-coder:7b again after
V5 had swapped in qwen2.5:7b. Two models on one GPU means alternating versions pay a model load. That's a
deployment decision (one model, or enough memory for both), now visible instead of guessed at.
What's verified, and what isn't
- 160 tests pass (125 unit, 35 integration), including spans and metrics from the real agent loop and audit
rows written to a real
AgentOpsdatabase. The CI steps also pass in the Linux .NET SDK image. - The container builds, runs as a non-root user, serves the UI, and reaches Ollama and Qdrant; a deliberately
wrong SQL login shows up as
Unhealthywith SQL Server's own message. A full answer from inside the container needs a SQL login on the server — the first step of the VPS deployment, not done yet. - Where the model runs in production (a GPU host, a smaller model, or a hosted model behind the same
IChatClient) is still open. The traces will make that comparison concrete.
Details: deployment guide, ADR 0011 — OpenTelemetry and the audit log, ADR 0012 — the container and edge limits.
Series: Part 1 · Part 2 · Part 3 · Part 4 · Part 5 · Part 6 · Project overview
Source code, setup guide and all decision records: AfzaalLucky/ai-database-agent on GitHub.
Continue reading
Related articles
AI Database Agent, Part 1: Naïve Text-to-SQL and Why It Fails Silently
The baseline every Text-to-SQL demo starts from — table names in, SQL out — measured against 32 real questions. 53% correct, seven silently wrong answers, and an UPDATE and a DROP TABLE sent to the database.
Read article →AI Database Agent, Part 2: Schema-Aware Prompting
Give the model what a human analyst would look at — types, keys, join paths, column descriptions, allowed values, business rules — as annotated DDL. Accuracy goes from 53% to 81%, and unsafe SQL executed drops to zero.
Read article →AI Database Agent, Part 3: Validating Generated SQL with a Real T-SQL Parser
Treat model-generated SQL as untrusted input: parse it with Microsoft's ScriptDom, check it against an allow-list and the real schema, estimate its cost, and feed exact errors back for repair. 88% correct, zero failures, zero unsafe SQL.
Read article →